Graphics in printed reports
   compleat botanica    using the software    printing    Reports   


Printed reports can contain graphical icons, colors, pictures, and special symbols.  When defining a new report style this feature can be kept or removed by specifying Use graphics or Substitute with text.

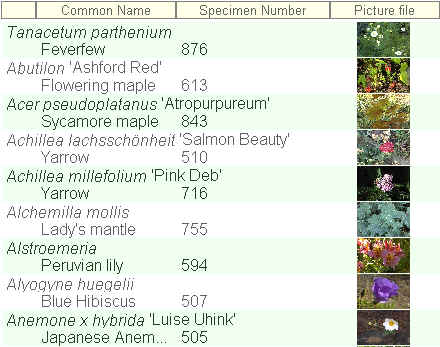
Here are examples demonstrating the types of graphical output available.

Report style Sample
Checkboxes
Icons
Date ranges and RHS colors
Height and spread
Climate zones
Symbols
More icons
Thumbnail pictures

See also

   Basic steps for printing specimen reports

   Tips for printing great looking reports

   Choosing a report style

   WYSIWYG print preview

   Defining report style fonts

   Defining report style borders and shading

   Defining report style options

   Defining report style margins

   Printing reports

Last reviewed March 25, 2004   


  Order your copy here